NAC Collection Settings
It is broadly classified into event collection by interworking between servers and agent installation, and several preliminary preparations are required to collect various information.
Environment Settings for Information Collection
Agent Actions:
- Prepare a .gpf file that starts with NAC-ThreatDetector2 .
- From System > Update, go to the Plugins menu.
- Double-click the gpf file prepared by clicking Tasks-Upload Plugin and clicking the Choose File button.
- When the file name is displayed on the screen, click the Upload button to upload the file.
- Go to Policy > NodePolicy > NodeAction.
- Click the Tasks -Create menu, enter an action name, and then select the Plug-in-Threat Detector2 item in the Settings section to enter basic information and click the Create button.
Server Actions:
- Log in to the NAC web console, and click Policy Server IP in the System > SystemSystem column.
- In the Environment Settings tab, change the Use or not in the **SNMP Agent Settings section to On**, enter the username and click the Edit button.
- Access the NAC CLI and set the IP that allows external access to the database.
Warning
The MySQL service on the NAC server will be restarted when IP settings are approved
- On the Roles screen, check insightsConnector and save it.
Note
insightsConnector can only be set in NAC Server version 4.0.1X,5.0.
- You can see that the insightsConnector account has been created in Settings > User Authentication > Roles.
- In the System > Users column, click Tasks -> User Registration.
- Set the System role to insightsConnector and create a user.
- In the UsersSettings tab, click the Create New Key button of the API Key item to create and save a new API.
- Create a nodegroup to select the nodes on which to install the plugin.
- Create a Node Policy to assign the node group created above.
- Assign and save the Threat Detector2 action.
- Click Apply ChangePolicy in the upper right corner.
NAC audit log collection
Environment Settings for information collection Once completed, Settings to get NAC audit logs from Insights E server are required.
- Log in to the Genian Insights E web console and click GENIAN NAC in the drop-down menu of the Configurator located in System > Collector Settings > Collector Sets.
- On the Add Collector Automation screen, enter information and click the Save button.
- Collector Sets name: Collector Sets name and Collector Sets description are the values displayed in the Collector Sets field.
- Server hostname: The server string that will appear in the log. - Center Address: Enter the Genian NAC Policy Server IP and the Genian NAC DB Server IP in the DB Server Address. - DB user name and PASSWORD: Enter the user name and PASSWORD of the NAC DB server.
- Select Audit Log from the information to be collected and save it.
- Click the Start button of the added Collector Sets in the Collector Sets field. If the NAC log collection (syslog) in the collector starts normally, you can see that the Genian Insights filter is created in Log > Search Filter in the Genian NAC web console. At this time, Insights<-> NAC-to-NAC communication CHARSET must be 'UTF-8'.
Note
In version 4.0.X, the following 4 steps are separately required for NAC server event processing after automatic search filter creation.
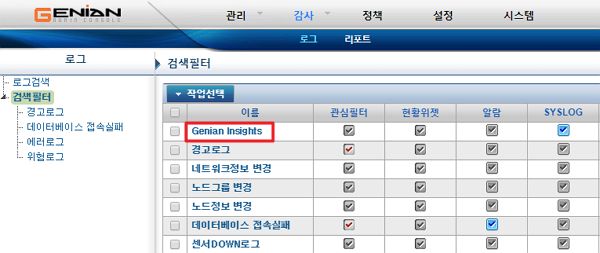
- Click on the generated Genian insights filter name as shown below.
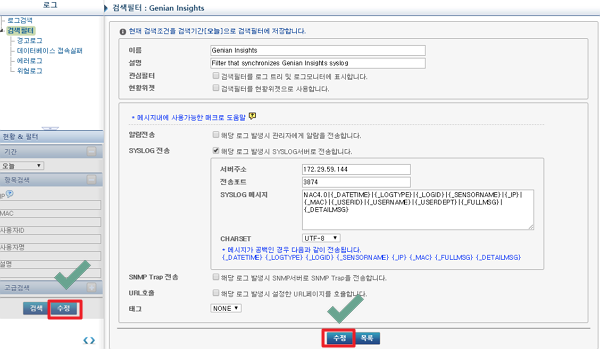
- Click the Edit button at the bottom left. The insights filter detail screen is displayed on the right. If you click the Edit button once more, syslog transmission starts from that point.
- Whenever an audit record is generated from the NAC server, data is sent to the Insights E server through syslog, and the log can be viewed in the Insights E web console Discovery > NAC logs menu.
NAC asset information collection
When the environment settings for information collection are completed, you can access the NAC server database from the Insights E server and collect various asset information of Endpoints.
- Log in to the Genian Insights E web console and click GENIAN NAC in the drop-down menu of the Configurator located in System > Collector Settings > Collector Sets.
- On the Add Collector Automation screen, enter information and click the Save button.
- Collector Sets name: Collector Sets name and Collector Sets description are the values displayed in the Collector Sets field.
- Server hostname: The server string that will appear in the log. - Center Address: Enter the Genian NAC Policy Server IP and the Genian NAC DB Server IP in the DB Server Address. - DB user name and PASSWORD: Enter the user name and PASSWORD of the NAC DB server.
- Select the asset information to be collected from the collection target information and save it.
- Click the Start button of the added Collector Sets in the Collector Sets field.
- Asset information is collected according to the collection cycle set by default, and the log can be checked in the Insights E web console Discovery > NAC Assets menu.