Integrating Infoblox DDI
This document describes how to integrate Infoblox with Genian NAC using syslog. This integration provides the ability to extend the Infoblox DDI Response Policy Zone (RPZ) feature into the Enforcement capabilities of Genians NAC. A full video Webinar covering this integration along with a demo is available on the Genians YouTube Channel.
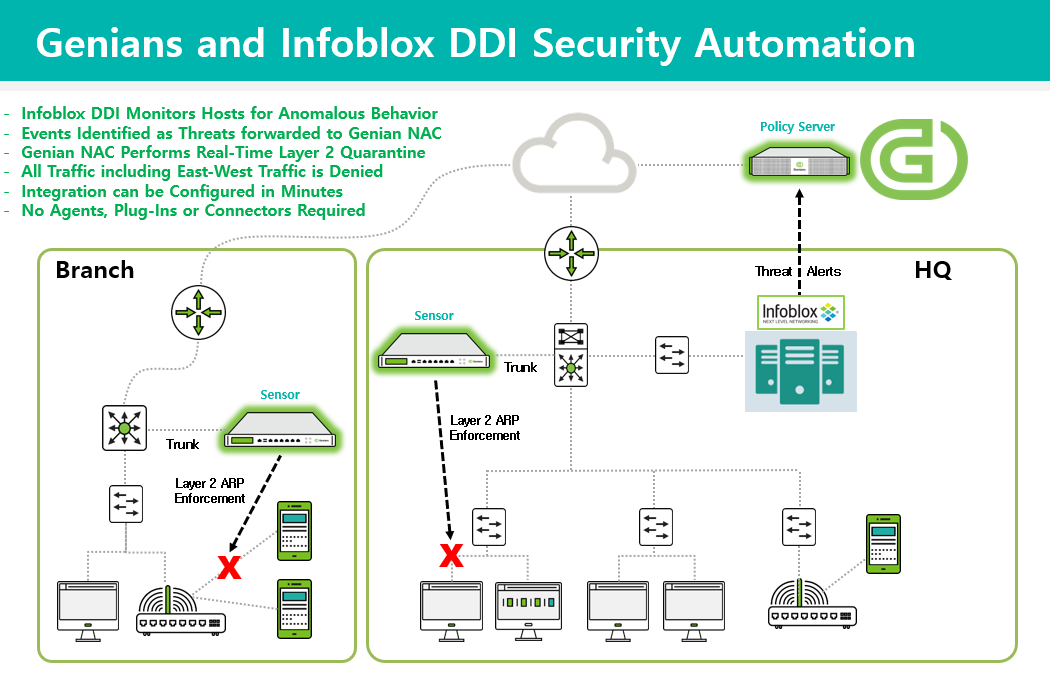
The main steps of this integration are as follows:
- Configure a domain to be blocked in Infoblox
- Export this blocking event to Genian NAC via syslog
- Configure Genian NAC to interpret this event, and apply enforcement to the impacted node.
Infoblox Domain Blocking Configuration
The steps below demonstrate how to configure and export critical RPZ events from Infoblox DDI to Genians via Syslog.
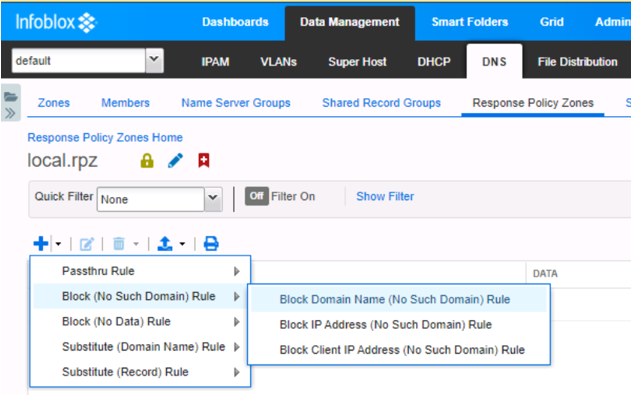
Navigate to Data Management > DNS > Response Policy Zones > local.rpz
Click + to add a new Block Rule for a Domain Name
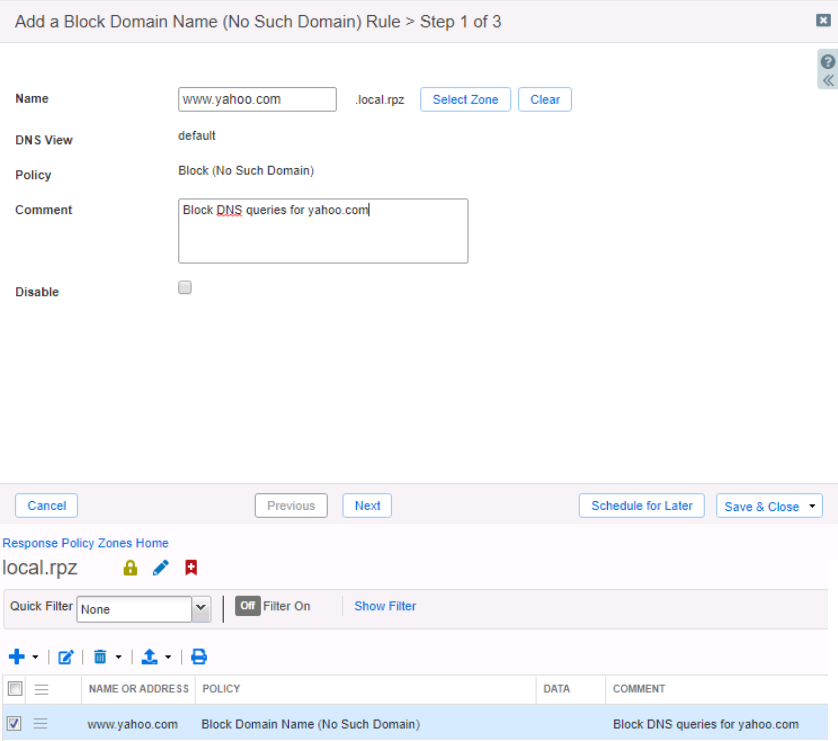
Enter a test domain name. In this example www.yahoo.com was used to simulate to simulate a Domain Name that is associated with a Malware Threat. Enter the Domain Name and a comment and then click Save & Close. No need to complete steps 2 and 3 in Infoblox.
Note
If your Infoblox Grid is already receiving Threat Intelligence from an external Threat Feed, then any sites listed as malware sites in that feed will also be blocked. Consult Infoblox documentation for additional details.
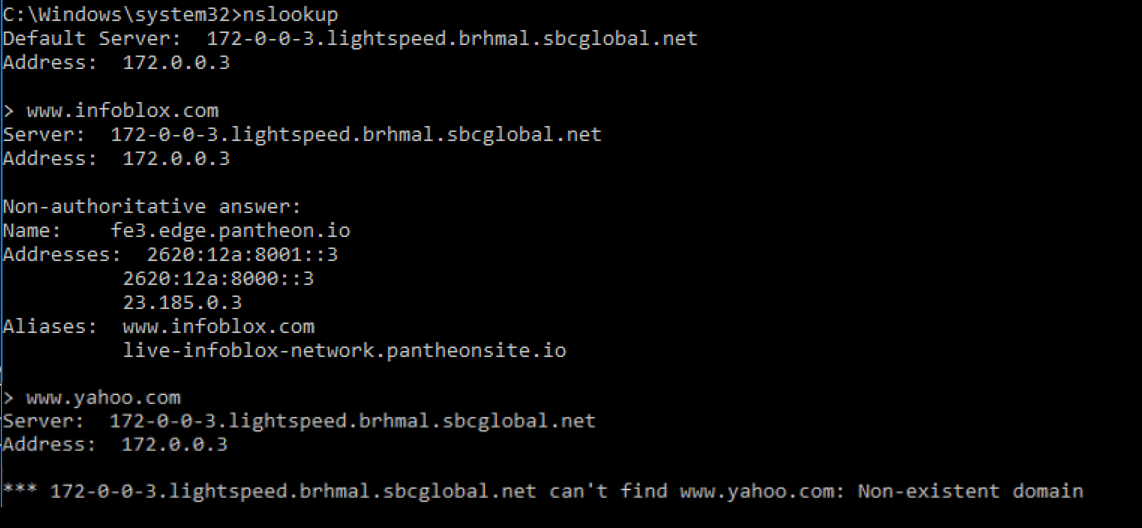
On a test machine subject to the previously configured Response Policy Zone, perform an nslookup on authorized domain (infoblox.com) and then perform an nslookup on unauthorized domain simulating malware site (www.yahoo.com).
Note Infoblox.com resolves fine but www.yahoo.com is returned as Non-existent domain. If you do not receive a Non-existent domain notification for the test malware site, consult Infoblox DDI documentation or support until the issue is resolved.
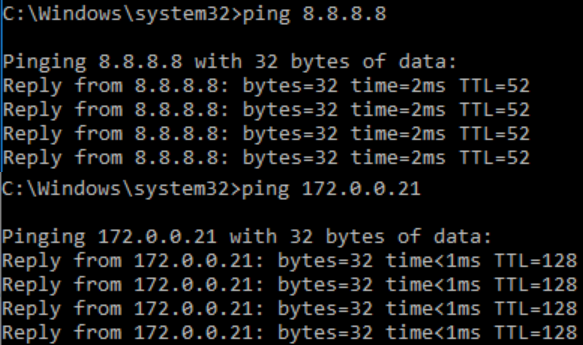
On the test machine, generate continuous pings to both an internal and external host. Note that even though Infoblox DDI has denied the domain from being resolved, the device still has network access, both to external and internal hosts:
Once the test above has been validated, perform the steps below to export Non-existent domain events to the Genian NAC Policy Server.
Infoblox Event Export Configuration
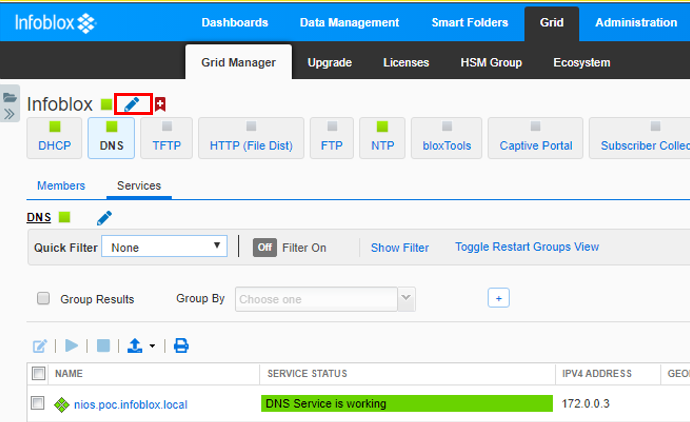
Navigate to Grid > Grid Manager and click on the edit button next to Infoblox.
Click on Monitoring and then click the + button to add a new Syslog server.
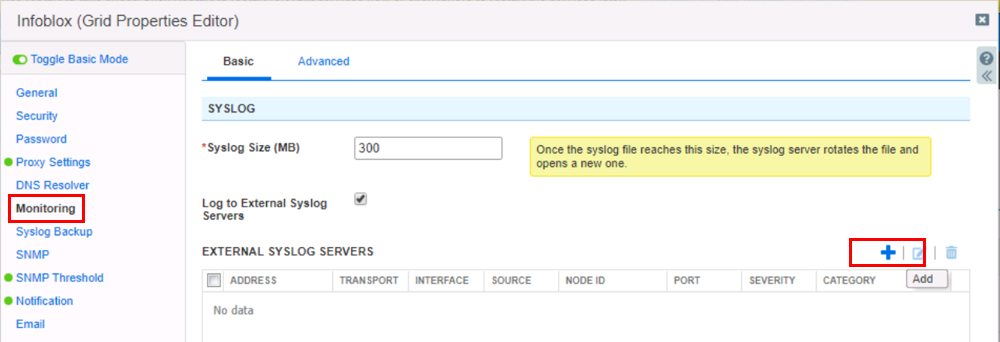
Check the Log to External Syslog Servers box and click the + button to add a new server.
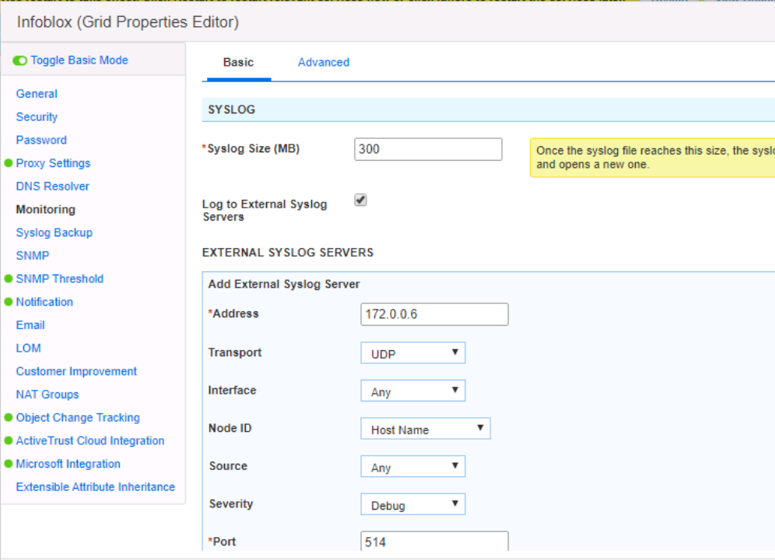
Enter the IP of the Genian NAC Policy Server, select UDP, Any for Interface, Host Name for Node ID, Any for Source, Debug for Severity and 514 for Port. Restart service in Infoblox DDI if prompted.
Genian NAC Syslog Server Configuration
A Server Rule set must be added before receiving syslogs. We will configure a server rule based on the format of the Infoblox message to extract information about the device to be blocked. In this integration, we will use the IP address.
These options may be found under General > Log in the Preferences section.
- Click the Add button to the right of the Server Rules label, and fill out the pop-up form.
- Enter a name for the Rule.
- For Filter,select a variable by which to evaluate incoming syslogs for allowance. Select from Program , Host, Match, or Netmask.
- Define a Filter Value. If the Filter variable of the imported syslog matches the Filter Value , the syslog will be merged into the policy server logs. Enter the appropriate network or program information so that the message from your Infoblox system will be recognized.
- Define src= as a prefix for IP values. This prefix will trigger the filter to import the value immediately following as an IP Address, allowing Genian NAC to identify the device using that IP.
- Define the character set which the syslogs will be imported in.
- Click Add at the bottom of the pop-up window.
- Click Update at the bottom of the Log Preferences page.
Now the message from the Infoblox system will be correllated with the nodes detected by Genian NAC.
Genian NAC Tag and Policy Configuration
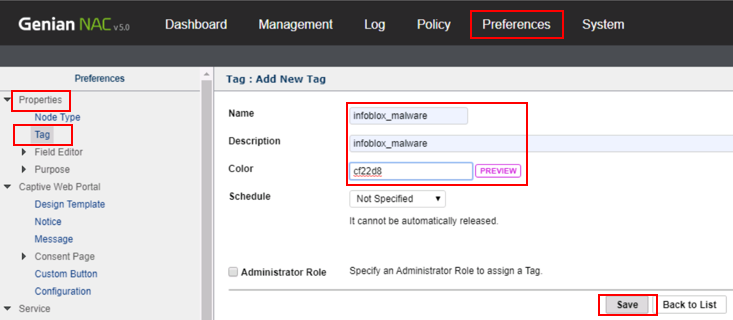
Navigate to Preferences > Properties > Tag and create a tag called “infoblox_malware” then click Save. This tag will be linked to a log filter and eventually to an Enforcement Policy in future steps.
Click on Log and then Add filters. Critical RPZ syslog alerts from Infoblox DDI include the key words “rpz QNAME NXDOMAIN”. Type these words into the Description field of the log filter and click Search.

The search results should show a syslog alert from Infoblox DDI showing rpz QNAME NXDOMAIN for www.yahoo.com. This alert was generated from the previous test on [Win-Client1]. Click Save to save as a log filter.
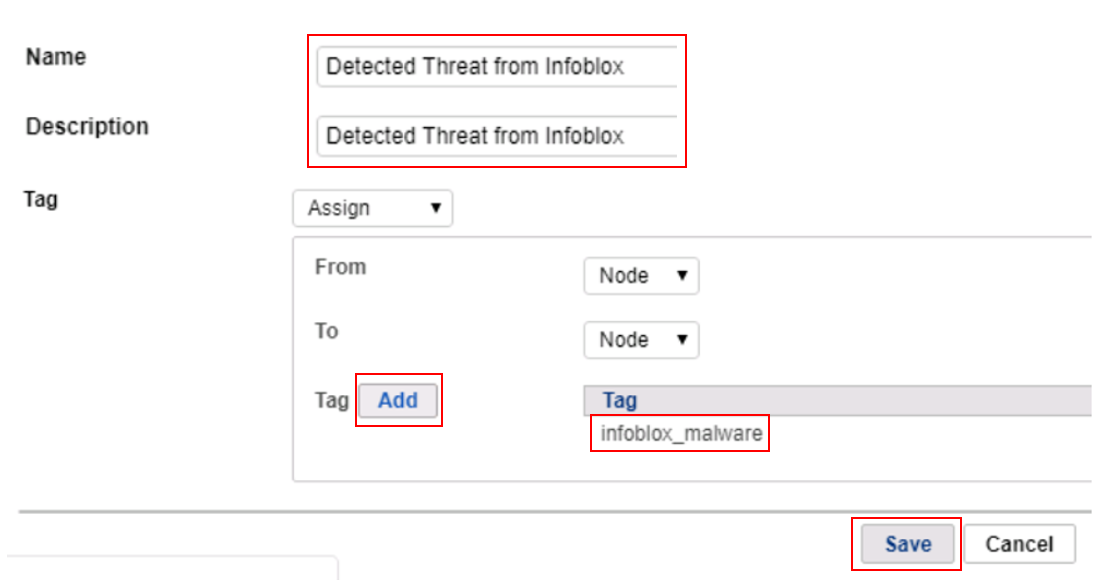
Give the log filter a name, description and add the previously created “Infoblox_malware” tag then click Save. In this example, we will apply the tag to the node (MAC+IP), though log filters can also apply tags to MACs, Users, or WLANs.
Navigate to Policy > Group then click Tasks > Create to create a new Node Group. Under General enter an ID and Description and set the Status to Enabled. Under Condition, click Add to add the previously created “Infoblox_malware” tag then click Save.
Navigate to Policy > Enforcement Policy then click Tasks > Create to create a new Enforcement Policy. Follow the wizard to create a new Enforcement Policy. Select the previously created “Infoblox_quarantine” Node Group, do not select any permissions (all access will be blocked by default), enable Captive Portal and enter a message to be displayed to the end user.
With all configurations now in place, the Genians Network Sensor must be switched from Passive to Active mode to facilitate the Layer 2 quarantine of non-compliant nodes on the network. Navigate to System > Sensor > Edit Sensor Settings and set the Sensor Operating Mode to Active then click Update at the bottom of the page.
To test the integration, from the test machine open a browser and navigate to www.yahoo.com. The page should not load. As a result of Infoblox enforcement DNS cannot be resolved, and no captive portal will be shown.
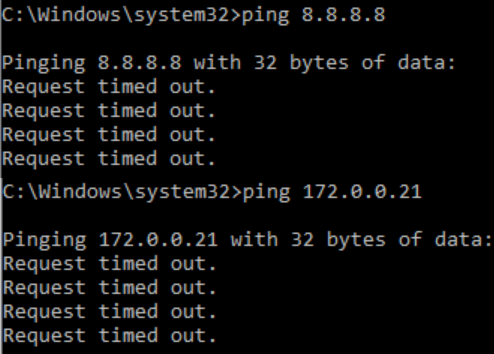
- However, behind the scenes, a rpz QNAME NXDOMAIN syslog alert has been sent from Infoblox to Genians and the host has been Layer 2 quarantined on the network. The test machine should no longer be able to ping external or internal hosts.
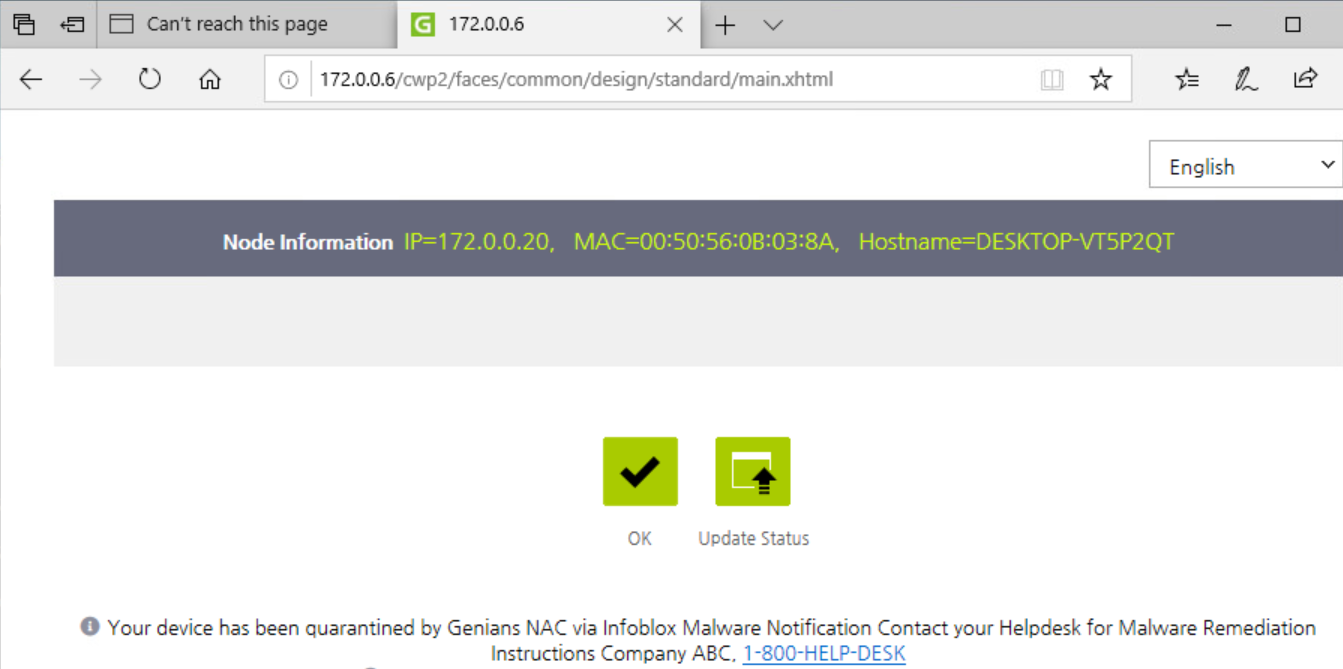
In the browser of the test machine, navigate to Infoblox.com and the Genians Captive Portal will be displayed with your message. Both the page design and contents may be customized, this is just a generic template.
Note
Pages using HTTP Strict Transport Security (HSTS) will not allow a Captive Portal to be displayed. Navigate to another site if you see an HSTS error.